


Introduction
Corporations can affect society and are simultaneously affected by society. Thus, corporations have duties not only to the shareholders, but to society, more specifically, stakeholders who can affect their decision-makings (Coffee, Gilson, & Quinn, 2021). Corporate social responsibility (CSR) is now perceived as a strategy required for sustainable growth beyond just improving the reputation or image of the company. However, while many companies in Korea are widely aware of the term “CSR,” they lack awareness regarding “corporate philanthropy”. Considering philanthropy as part of CSR, perceiving it as a concept of charity may distort its value. Therefore, it is necessary to evaluate the process and outcomes of undertaking philanthropic activities, based on which new business strategies emerge (McAlister & Ferrell, 2002). Corporate Philanthropy is an activity in which a company participates in the relevant social organization by distributing funds, resources, or goods to a field that is a fundamental social problem (Seifert, Morris, & Bartkus, 2003). This study extends these findings on consumers’ attributions towards corporate philanthropy by proposing a new model that integrates the hypothesized relationships among different perceived factors of corporate philanthropy in South-Korea. This study derives the four perceptional factors of corporate philanthropic activities from a review of prior studies (Han, 2021). It analyzes how these factors affect the brand asset and customer loyalty expected from philanthropic activities in terms of corporate identification and trust. And it offers useful perspectives on the type of communication and benefit to the nation, society and humanity.
Theoretical Framework
Although the demands of stakeholders related to corporate philanthropy are increasing, there is no dedicated department in charge of the strategy. Thus, companies still perceive corporate philanthropy as a passive philanthropic action or social compulsion (Masoud, 2017). Therefore, companies are not able to engage in corporate philanthropy owing to the active communication process with consumers (Nguyen & Mogaji, 2022). Corporate philanthropy is passively attracted to social issues, the prevailing atmosphere and public opinion (Hong, Wei, & Wang, 2022). Thus, it is important to understand which factors that make up corporate philanthropy are important to consumers (Ali, Danish, & Asrar‐ul‐Haq, 2020). Corporate philanthropic activities must be carried out based on the understanding and consideration of key areas of focus, judgment and selective decision-making (Ashrafi, Magnan, Adams, & Walker, 2020).
Previous studies conducted show that transparency, sustainability, authenticity, value congruence, conformity, corporate ethics and corporate reputation are recognized as the main perception elements of corporate philanthropy (Han, 2021). As the anti-business sentiment is relatively high in Korean society, transparency can serve as a factor that alleviates public doubts regarding corporate philanthropy by providing information about the company’s motives (Hwang, Bae & Kim, 2017). Sustainability is presented as a factor that determines whether philanthropy is carried out with authenticity (Wai Yee, Hassan, & Ramayah, 2016). Authenticity serves as an important cue in consumers’ judgment of a company (Napoli, Dickinson, Beverland, & Farrelly, 2014). Value congruence is the extent to which the values consumers have overlapped with the products and the brand image the company intends to portray and the social value of philanthropy (Rather, Tehseen, & Parrey, 2018).
In this study, brand equity and consumer loyalty were considered dependent variables of corporate philanthropy communication, and a research model was designed. The most important reason was the opinions of corporate executives and employees who were actually in charge of corporate philanthropy (Chatterji, Levine, & Toffel, 2009). The ultimate entity that implements corporate philanthropy is the enterprise; it dedicates manpower, sets up a strategy related to corporate philanthropy and spends money (Gautier & Pache, 2015). In-depth interviews with corporate philanthropic executives revealed that enterprises ultimately wanted to know about two factors: brand equity and consumer loyalty. These factors are most basic and final goal of carrying out corporate philanthropy (Von Schnurbein, Seele, & Lock, 2016).
Consumer-company identification, the characteristic of identifying consumer characteristics and social identity affects the consumer’s response to product stimuli and acts as a factor that increases consumer’s loyalty (Raza et al., 2020). Consumer trust is a prerequisite for the formation and maintenance of long-term relationships between companies and consumers and research is a prerequisite for brand equity or brand identification (Syed Alwi, Nguyen, Melewar, Loh, & Liu, 2016). Based on these studies, it is possible to establish a hypothesis to understand the relationship between the perception factors of corporate philanthropy, corporate identity and consumer trust.
A comparative analysis of the effects of consumer satisfaction and consumer-company identification found that, they affect consumer behavioral intentions such as consumer loyalty and repurchase intention. It was confirmed that the identification and integration of companies affects consumer behavioral intentions such as purchase intentions (Bonn, Cronin, & Cho, 2016). Consumer loyalty, from a behavioral point of view, means that a consumer actually repurchases a specific product or service; from an attitude point of view, consumer loyalty means the intention to continue to use it in the future (Tussyadiah, 2016).
Corporate philanthropy evokes empathy about recognizing and solving social problems with the goal of benefitting society and stakeholders by resolving environmental problems (Muller, Pfarrer, & Little, 2014). Based on information about the company’s motives, details of philanthropic activities, and methods of corporate philanthropy, people judge the authenticity of the company’s philanthropic efforts (Kwak, Lee, Song, & Lee, 2022). Another factor that moderates consumers’ acceptance of corporate philanthropic activities is value congruence, which refers to how consumers feel regarding whether they are in congruence with the company’s character and values (Jeong, Kang, & Choi, 2022). Consumer response to corporate philanthropy has a positive effects on corporate evaluation depending on the congruence or dissimilarity in the characteristics of corporate philanthropy and consumer characteristics, which are moderated by consumer support (Maisam, & Mahsa, 2016). Value congruence refers to the perceived similarity between the individual values of consumers and the values of the service brand and it is considered a key factor in service. Based on the above, the following are our hypotheses.
-
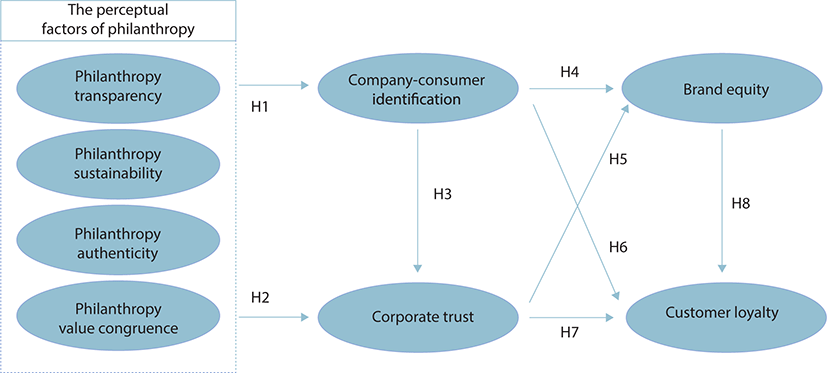
H1: The factors contributing to consumers’ perceptions of corporate philanthropy have a positive effect on consumer-company identification.
-
H1a: Consumer perception of the transparency of corporate philanthropic activities has a positive effect on consumer-company identification.
-
H1b: Consumer perception of the sustainability of corporate philanthropy has a positive effect on consumer-company identification.
-
H1c: Consumer perception of the authenticity of corporate philanthropy has a positive effect on consumer-company identification.
-
H1d: Consumer perception of the value congruence of corporate philanthropy has a positive effect on consumer-company identification.
-
-
H2: The factors contributing to consumers’ perceptions of corporate philanthropy have a positive effect on consumer trust.
-
H2a: Consumer perception of transparency in corporate philanthropy has a positive effect on consumer trust.
-
H2b: Consumer perception of the sustainability of corporate philanthropy has a positive effect on consumer trust.
-
H2c: Consumer perception of the authenticity of corporate philanthropy has a positive effect on consumer trust.
-
H2d: Consumer perception of the value congruence of corporate philanthropy has a positive effect on consumer trust
-
-
H3: Consumer‐Company identification has a positive effect on consumer trust.
If consumers identify with a company, they tend to have a positive attitude toward the company. Meanwhile, consumer trust is a precondition for the formation and maintenance of long-term relationships between the company and the consumer, serving as a leading variable of brand equity or brand identification. An increase in consumer trust in the company leads to an increase in consumer behavioral intentions such as repurchase intentions. Thus, we hypothesize:
Consumer trust regarding a company’s adherence to ethical behavior is one of the outcomes of a company’s philanthropic activities and serves as a key factor in consumers’ behavioral intentions. Previous studies have shown that an increase in consumer trust affects brand attitude as well as consumer behaviors such as repurchase intentions. Previous studies have analyzed consumer satisfaction and consumer-company identification and discovered that these two variables affect consumers’ behavioral intentions such as loyalty and repurchase intentions. Thus, we hypothesize:
-
H6: Consumer-Company identification has a positive effect on consumer loyalty.
-
H7: Consumer Trust has a positive effect on consumer loyalty.
Brand trust increases consumer loyalty, and values form brand attachment which may lower consumers’ price sensitivity and increase consumer loyalty and profitability. They importance of brand equity as a factor in consumer equity, has a significant effect on the probability of consumer repurchasing. This study set up the hypothetical model shown in Figure 1.
Methods
Transparency as a measurement tool for consumers’ perceptions of corporate philanthropy is defined as the extent to which the purpose of corporate philanthropy activities, participation details, and relevant expenditures are faithfully carried out, and the extent to which the relevant information is transparently delivered to consumers. Sustainability refers to consumers’ perception of continuity of a company’s philanthropic efforts. Authenticity refers to the extent to which the company’s philanthropic activities are fulfill its fundamental duties and responsibilities with authenticity while meeting the perceived expectations of consumers. The measurement items used in this study are those used to determine whether the values pursued by the company’s philanthropic activities are consistent with the direction of values consumer respondent expects from a company, whether purchasing the company’s products or services will bring the respondent consumer to realize the social values they expect through this company’s philanthropic activities.
Consumer-company identification indicates the extent to which consumers perceive or identify with certain attributes of a company an emotional or psychological bond with the company. The following measurement items used were for this variable: whether the company carrying out philanthropic activities suits the respondent and whether the development and growth of this company feel like their own. Consumer trust is the consumers’ belief that the company’s words or promises are reliable and that it will fulfill its duties in this relationship of exchange, as well as the expectation and confidence that the company wants bilateral cooperation. The following measurement items were used for this variable whether the company carrying out philanthropic activities can be trusted and whether it is safe to do business with this company. Brand equity comprises brand awareness and perceived brand quality. The measurement item used for variable was whether the company was the first to come to mind of the respondent in terms of brand images.
This study aims to verify how the factors contributing to consumers’ perceptions corporate philanthropy affect brand equity and consumer loyalty, mediated by consumer-company identification and trust. The subjects were limited to general consumers, and the research was conducted using the following procedures. First, based on a literature review, this study examined the factors contributing to consumers’ perceptions of corporate philanthropy and set the relationship between the mediator and dependent variables. Multivariate data analysis 6th Edition (Hair, Black, Babin, Anderson, & Tatham, 2006). Second, the measurement tools for each variable were selected from previous studies, and survey items were reviewed and finalized with respect to measuring corporate philanthropy activities (Bowen & Guo, 2011). Data were collected for 2 weeks from October 14, 2020 with the online survey, frequency analysis was conducted on the collected data to determine respondents’ the demographic and job characteristics. The hypothetical model was validated using structural equation modeling (SEM), and the mediating effects were validated using the bootstrap method.
Results
After surveying the top three priorities, it was observed that support for vulnerable groups was the top priority for 75 (65.8%) out of 114 companies, thereby showing the highest frequency. This was followed by contribution to education/school/academic programs by 56 companies (49.1%), contribution to culture, arts, and sports by 43 companies (37.7%), emergency/disaster relief by 42 companies (36.8%; Table 1).
The means were verified to examine the level of each variable, and standard deviations, skewness and kurtosis were examined to test the normality and distribution of the perception level. Skewness and kurtosis were used to determine normality. Acceptable values of skewness fall between –3 and +3. Kurtosis is an indicator that shows whether symmetrical distribution is concentrated toward the mean as compared to the normal distribution with the same variance or whether it is evenly distributed from the mean. Acceptable values of kurtosis fall between –10 and +10. The results of the analysis showed that the absolute value of skewness was .283–.656, and that of kurtosis was .053–.636, thereby showing normality. Moreover, the initial reliability of each scale pertinent to the abovementioned factors contributing to consumers’ perceptions of corporate philanthropy was analyzed by using Cronbach’s α. The results indicate that all the scales were reliable (Table 2).
The measurement model was evaluated to validate the reliability of the measurement tools used to measuring the variables prior to hypothesis testing. Assessment of the model is related to how well the measurement variables materialize or explain the latent variables that are not directly measured, focusing on analyzing the relations between latent and measurement variables. This is generally accomplished with confirmatory factor analysis and its reliability and validity have already been confirmed by previous studies. A multivariate data analysis was conducted with all variables of considered for analysis at the same time.
The validation of the model was conducted by testing convergent validity, which indicates how well the intended measures developed based on theories and testing discriminant validity, which indicates whether the variables and factors have properties that distinguish one from another. Convergent validity was tested using factor loading, average variance extracted (AVE) and construct reliability (CR). Factor loading must be at least 0.5 to ensure convergent validity; AVE, which measures the size of the pooled variance in the latent variables must be at least 0.5; CR must be higher than 0.7. The indices of the convergent validity of the latent variables used in this study were acceptable. The results of the confirmatory factor analysis showed that the AVE of each factor was higher than 0.5, the CR was higher than 0.7, confirming the convergent validity of the key factors of the research model. However, the standardized coefficient was lower than 0.5 in the analysis process, and variables inhibiting convergent validity, such as transparency (V01_02), brand equity (V03_09), consumer loyalty (V04_05) were eliminated (Table 3).
Discriminant validity was tested by comparing the AVE and correlation coefficient among latent variables. AVE is an indicator that measures the size of the pooled variance in latent variables, and the factors are considered different if AVE is greater than the variance shared. In this study, validation was confirmed by comparing the AVE of each variable and the correlation coefficient squared, or by comparing the square root of AVE of each variable and correlation coefficient. The results of the analysis showed that the square root of AVE was greater than the correlation coefficient; consequently, the discriminant validity of the measures was established.
The hypotheses of the research model were analyzed by using SEM. SEM combines regression and factor analysis by improving both for the analysis of causality, and it is frequently used in studies that use theoretical concepts that are difficult to observe directly. The fit of the model was assessed by using the absolute fit measure (AFM) and increment fit measure (IFM) using the p-value for the chi-square (χ2) of AFM. However, χ2 is sensitive to sample size and approaches 0 if the sample size increases; thus, the value obtained by dividing χ2 by the degree of freedom is used to determine whether this value exceeds 3 (Bentler & Bonnett, 1980). Furthermore, the χ2 test is also sensitive to the assumption of multivariate normality and thus the overall fit of the model is determined by using the fit indexes that excludes χ2. The model is considered fit if the goodness-of-fit-index (GFI) and root-mean-square error of approximation (RMSEA) are ≤ .08.
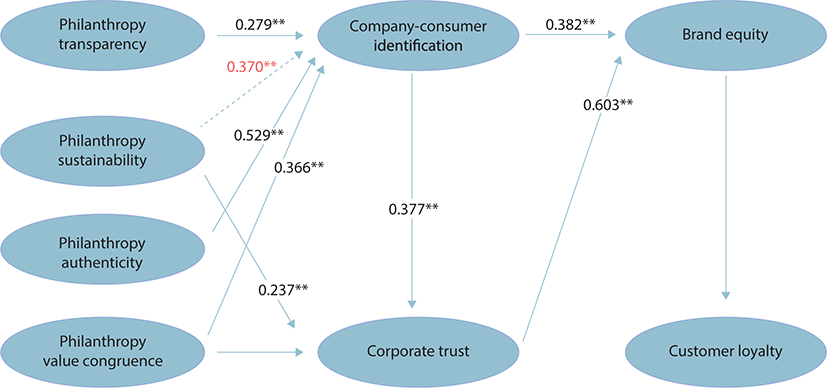
For assessing IFM, normed fit index (NFI) and non-normed fit index (NNFI = TLI) were used. The results of the analysis showed that the GFI of the hypothetical research model was χ2 = 1,029.701 (p = .000), df = 397, CMIN/DF = 2.594, GFI = .829, CFI = .906, TLI = .897, RMSEA = .068, and SRMR = .049, indicating that the model fits the data well. The results of analyzing each path of the research model are as follows. First, regarding the effects of the factors contributing to consumers’ perceptions of corporate philanthropy on consumer‐company identification, it was observed that the consumer perception of transparency of corporate philanthropy had a statistically significant positive effects on consumer‐company identification (β = .279, t = 3.543, p < .01), thereby supporting H1a. Consumer perception of the authenticity of corporate philanthropy also had a statistically significant positive effects on consumer-company identification (β = .529, t = 3.439, p < .01), thereby supporting H1c. Furthermore, consumer perception of the value congruence of corporate philanthropy also had a statistically significant positive effects on consumer-company identification (β = .366, t = 2.791, p < .01), thereby supporting H1d. On the other hand, consumer perception of sustainability of corporate philanthropy had a statistically significant negative effects on consumer-company identification (β = –.370, t = –2.445, p < .05), thereby rejecting H1b.
Moreover, as antecedent factors of consumer-company identification, the explanatory power (squared multiple correlations, SMC) of the consumer perception of transparency, sustainability, authenticity, and value congruence of corporate philanthropy was 58.2%. Second, regarding the effects of the factors contributing to consumers’ perceptions of corporate philanthropy on consumer trust, consumer perception of the sustainability of corporate philanthropy had a statistically significant positive effects on consumer trust (β = .237, t = 2.227, p < .05), thereby supporting H2b. Consumer perception of the value congruence of corporate philanthropy also had a statistically significant positive effects on consumer trust (β = .238, t = 2.603, p < .01), thereby supporting H2d. Consumer perception of the transparency and sustainability of corporate philanthropy did not show a statistically significant effects on consumer trust. In other words, the effects of consumer perception of transparency of corporate philanthropy on consumer trust was β = –.054 (t = –0.961, p < .336) and the effects of consumer perception of the authenticity of philanthropy on consumer trust was β = .200 (t = 1.844, p = .065), thereby rejecting H2a and H2c, respectively. Since the main purpose of this study is to validate the structural relationship among variables, confirmatory factor analysis was conducted in the same context (Tables 4, 5).
| Good ness of fit | χ2 (p) | df | χ2/df | GFI | CFI | TLI | RMSEA | SRMR |
|---|---|---|---|---|---|---|---|---|
| Numeric | 1,976.6 (.000) | 915 | 2.161 | .804 | .926 | .919 | .055 | .048 |
| Standard | - | - | < 3 | > .8–.9 | > .9 | > .900 | < .08 | < .05–.1 |
Regarding the effects of consumer‐company identification on consumer trust, consumer-company identification had statistically significant positive effects on consumer trust (β = .377, t = 6.705, p < .01), thereby supporting H3. As antecedent factors of consumer trust, the explanatory power (SMC) of consumer perception of sustainability and value congruence of corporate philanthropy was high at 83.3%. Regarding the effects of consumer-company identification and consumer trust on brand equity, both consumer-company identification and consumer trust had statistically significant positive effects on brand equity. In other words, the effects of consumer-company identification on brand equity were β = .382 (t = 6.073, p < .01), and the effects of consumer trust on brand equity was β = .382 (t = 9.13, p < .01), thereby supporting H4 and H5, respectively. Moreover, as antecedent factors of brand equity, the explanatory power (SMC) of consumer-company identification and consumer trust was high at 88.0%.
Finally, regarding the effects of consumer-company identification, consumer trust, and brand equity on consumer loyalty, only brand equity had a significant positive effects on consumer loyalty. The effects of brand equity on consumer loyalty was β = .970 (t = 6.188, p < .01), supporting H7. And as an antecedent factor of consumer loyalty, the explanatory power (SMC) of brand equity was high at 89.1%. Consumer trust and consumer-company identification did not show a statistically significant effects on consumer loyalty. The effects of consumer trust on consumer loyalty were β = –.062 (t = –0.587, p = .557), and the effects of consumer-company identification on consumer loyalty was β=.034 (t = 0.423, p = .672), thereby rejecting H6 and H8, respectively. These results are summarized in Tables 6, 7 and Figure 2.
| Factor | AVE | 1 | 2 | 3 | 4 | 5 | 6 | 7 | 8 | |
|---|---|---|---|---|---|---|---|---|---|---|
| 1 | Philanthropy transparency | 0.620 | .787 | |||||||
| 2 | Philanthropy authenticity | 0.552 | .654** | .743 | ||||||
| 3 | Philanthropy sustainability | 0.653 | .703** | .714** | .808 | |||||
| 4 | Philanthropy value congruence | 0.604 | .602** | .761** | .729** | .777 | ||||
| 5 | Consumer‐company-identification | 0.609 | .571** | .691** | .577** | .683** | .780 | |||
| 6 | Consumer trust | 0.660 | .609** | .732** | .697** | .769** | .776** | .812 | ||
| 7 | Brand equity | 0.578 | .577** | .696** | .643** | .724** | .717** | .732** | .760 | |
| 8 | Consumer loyalty | 0.682 | .517** | .652** | .583** | .698** | .738** | .772** | .756** | .826 |
This study used the bootstrap method to analyze the direct and indirect effects and the total effects size of the correction model. The results showed that the effects (indirect effects) of factors contributing to consumers’ perceptions of corporate philanthropy on consumer loyalty through consumer-company identification, consumer trust, and brand equity were statistically significant (β = .000, p < .01). Specifically, consumer perception of transparency of corporate philanthropy had a significant indirect effects on consumer trust mediated by consumer‐company identification (β = 0.105, p < .05). It also had a significant indirect effects on consumer loyalty mediated by consumer-company identification, consumer trust, and brand equity (β = 0.140, p < .05).
Consumer perception of the authenticity of corporate philanthropy also had a significant indirect effects on consumer trust mediated by consumer-company identification (β = 0.200, p < .05). It also had a significant indirect effects on brand equity mediated by consumer-company identification and consumer trust (β = 0.440, p < .05) and on consumer loyalty mediated by brand equity (β = 0.423, p < .05). Consumer perception of the value congruence of corporate philanthropy also had a significant indirect effects on brand equity mediated by consumer-company identification and consumer trust (β = 0.367, p < .05), and on consumer loyalty mediated by consumer-company identification, consumer trust and brand equity (β = 0.345, p < .05). Consumer-company identification had an indirect effects on brand equity mediated by consumer trust (β = 0.228, p < .05), and on consumer loyalty mediated by consumer trust and brand equity (β = 0.568, p < .05).
Finally, consumer trust had an indirect effects on consumer loyalty mediated by brand equity (β = 0.585, p < .01). As a result of testing the hypothesis model, it was found that among the corporate philanthropy perception factors, the philanthropy transparency factor, philanthropy authenticity facto, and value congruence factor had a statistically significant positive relationship with company identification. These results suggest that perceptual factors should be considered at a strategic level rather than simply approaching the results or outcomes of corporate philanthropy. This shows that if consumers recognize the validity or rationality of philanthropy, they can feel a sense of unity with the company and form a strong emotional and psychological bonds. If companies strategically implement corporate philanthropy based on such communication, consumers will have a positive perception of the products and brands. Furthermore, it seems that this can act as a factor in forming a strong relationship not only with the company but also with the company’s products and brands. In addition, philanthropic sustainability and value congruence were found to have a statistically significant positive effect on corporate trust.
Moreover, the company identification factor was found to have a statistically significant positive relationship with consumer trust. These results allow companies to make corporate philanthropy consistent, lasting medium or long-term, and if this intension is recognized by consumers, they can trust that the company will not abandon its philanthropic obligations. Furthermore, consumers can have greater expectations and confidence that the company will fulfill its obligations and responsibilities through cooperation. Therefore, a strategy should be developed so that a company can clearly reflect the pursuit of the public interest in society in philanthropy activities while maintaining the consistency of its values.
Based on this, companies can focus their activities on social and consumer values by actively utilizing communication to form a consensus among consumers. In the relationship between company identification and consumer trust on brand equity, both company identification and consumer trust were found to have a statistically positive significance for brand equity. In the relationship between company identification factor and consumer trust on brand equity, both company identification and consumer trust were found to have a statistically positive significance on brand equity. This makes consumers perceive the company’s products and services as superior quality compared with competitors.
In addition, it can act as a factor that can form a brand asset by having a positive effect on the attitude and perception of the brand, as well as on related products and services. In the relationship between company identification, consumer trust, brand equity and customer loyalty, only brand equity was found to have a statistically significant positive relationship with consumer loyalty. Companies seek to induce potential or actual consumers to purchase products and services and to maintain a lasting positive relationship. Such communication can encourage consumers to repurchase products or make recommendations to others. To maintain a high level of consumer loyalty, philanthropic activities are essential in addition to product or service quality. By exposing philanthropy communication to consumers for a long time, brand equity can be increased. By acquiring the transparency of philanthropy activities and having authenticity, continuity, and value congruence of the activities, consumers can increase their sense of unity with the company.
Thus strong brand equity can be expected based on trust in the company, which means that it can lead to consumer loyalty based on philanthropic communication. However, among the analysis results, Philanthropy sustainability was found to have a negative (–) effect on the company identification factor. This seems to be owing to the relationship between consumers’ expected direction and the expected value of corporate philanthropy activities. It implies that the activities of sustainable philanthropy do not match the expectations of the public in terms of areas or methods when consumers perceive unity with companies. However, philanthropic transparency and authenticity do not appear to have a direct impact on corporate trust. This result is different from the original hypothesis. Based on the assumption that philanthropic value congruence and sustainability mediate corporate trust, it is estimated that Korean companies have recently shown transparent and authentic activities in various ways.
In our result, company identification did not mediate consumer loyalty. Considering that research on company identity and consumer loyalty has not been conducted in-depth, it does not seem necessary to conclude that the two variables are unrelated. Among the analysis results, the persistence factor of the philanthropy perception factor was found to have negative effects on the consumer-company identification factor. This is due to the relativity of the expected direction of the public or the expected value of the company’s philanthropic activities (Table 8).
Discussion
The study is significant in that it examined the process by which above factors lead to brand equity and consumer loyalty through the mediating variables of company-consumer identification and consumer trust. This study has more immediate practicality than existing studies as companies can apply these findings directly to corporate philanthropy. Another characteristic of this study is that it attempted to identify brand equity and consumer loyalty, which have been perceived as comprehensive concepts so far, by separating them into separate variables. To date, most studies examining the responses of consumers and the public related to corporate philanthropy activities have been conducted with brand equity or consumer loyalty as a dependent variable (Malik & Kanwal, 2018). However, during the investigation process, corporate research institute officials who conducted in-depth interviews made significant efforts to separate and identify brand equity and consumer loyalty in corporate activities.
As a result of a hypothesis test for the model, the perceptual factor of corporate philanthropy had a statistically significant positive effects on philanthropy authenticity and value congruence when the identification with a company took place. This result implies that perceptual factors should be considered at a more strategic level. It also shows that consumers can access and verify information on the purpose of corporate philanthropy activities, participation details, related costs, and investment details through various channels. When a company is perceived to be responsibly performing philanthropic activities as an obligation based on the sharing of the company’s value strategy that society expects, it will positively affect the formation of strong bonds by increasing the public’s sense of unity (Al Mubarak, Ben Hamed, & Al Mubarak, 2019). This act as an element of forming strong relationships with the companies, products, and brands. In terms of the relationship in which company identification and trust affect brand assets, company identification and trust were found to have a statistically significant positive effects on brand assets.
Corporate philanthropic activities lead to positive attitudes toward the company and brand because of the level of integral feelings or perceptions in the emotional and psychological relationship. This can help the consumers identify with the company, cast a positive impression in the public’s mind about the brand, and raise the perception of superior quality compared to other related products and services (Xie, Bagozzi, & Grønhaug, 2019). It positively affects the attitude toward the brand, perception of the brand, and related products and services. Among the effects of company identification, trust and brand assets on consumer loyalty, only brand assets were found to have a statistically significant positive effects on consumer loyalty.
Apart from maintaining the quality of products and services, companies expose and stimulate the public through philanthropic activities to produce loyal consumers who can make repurchases and positive recommendations to others, thereby leading potential consumers to purchase behaviors for referred products and services and maintaining a continuous relationship (Nisar & Whitehead, 2016). This implies that philanthropy can lead to relationship-based loyal consumers. However, among the analysis results, the persistence factor of the philanthropy perception factor was found to have negative effects on the consumer-company identification factor. This is because the relativity of the expected direction of the public or the expected value of the company’s philanthropic activities. The study is significant in that it examined the process in which these factors lead to brand equity and consumer loyalty through the mediating variables of company-consumer identification and Consumer Trust based on the above points. This is an important difference between previous studies and this study.
Conclusion
This result indicates that factors contributing to consumers’ perceptions of corporate philanthropy must be considered at a more strategic level. Moreover, if corporate philanthropy activities are carried out as a duty and responsibility based on the sharing of the company’s resources to pursue values anticipated by society, it will also increase consumer-company identification, thereby having a positive effect on forming a strong company-consumer bond. Furthermore, regarding the effects of the factors contributing to consumers’ perceptions of corporate philanthropy and consumer trust, consumer perception of sustainability and value congruence of corporate philanthropy had a statistically significant positive effects on consumer trust. Moreover, regarding the effects of consumer-company identification on consumer trust, consumer-company identification had a statistically significant positive effects on consumer trust. Therefore, companies must clearly reflect their pursuit of social benefits in their philanthropic activities, establish a strategic system to maintain consistency of values and set goals and plans that are not just short-term or provide one-time support, thereby taking a phased approach that can lead to gradual and progressive results. Regarding the effects of consumer-company identification and consumer trust on brand equity, both consumer-company identification and consumer trust had a statistically significant positive effects on brand equity. Finally, regarding the effects of consumer-company identification, consumer trust and brand equity on consumer loyalty, only brand equity had a statistically positive effects on consumer loyalty.